How to send client growth reports that non-technical clients understand?
VeloCMS compiles monthly growth reports that turn rankings, backlinks, articles and traffic into plain sentences your clients can read in two minutes.
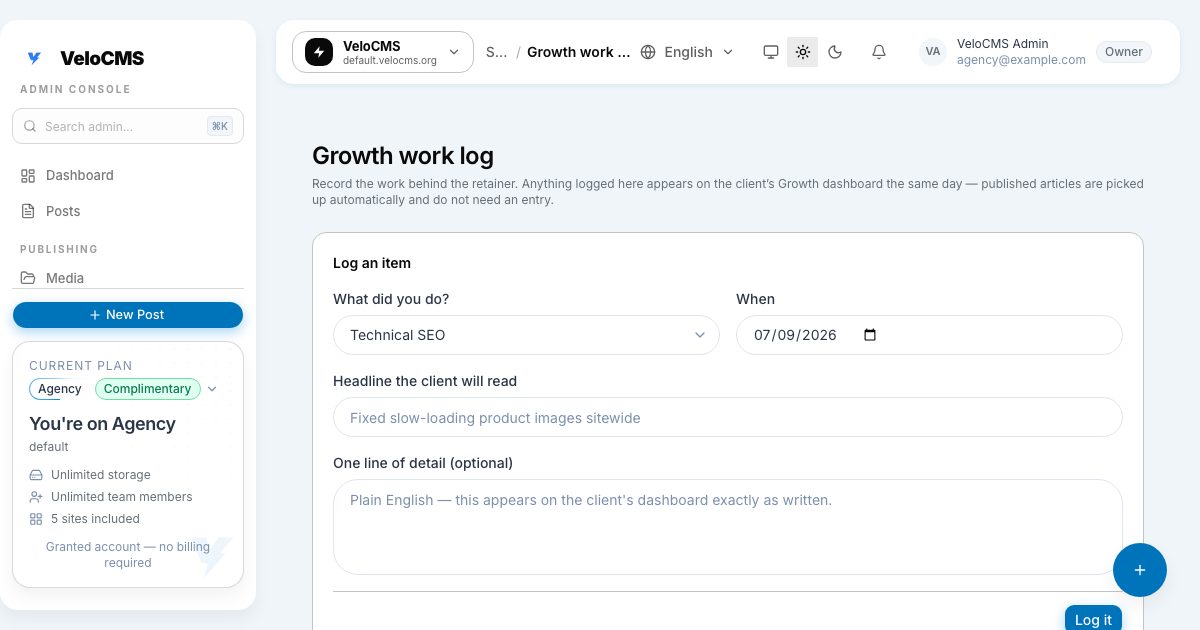
You can send plain-language client growth reports directly from VeloCMS using our new automated reporting engine. These monthly summaries turn search rankings, backlinks, published articles and site traffic into plain sentences your clients can read in two minutes. This eliminates manual spreadsheet exports while clearly showing the business value of your work.
If you run an agency or manage client sites, you know the dreaded monthly reporting cycle all too well. You export three different CSV files, screenshot a handful of web traffic charts, paste them into a slide deck, and email it off into the void. Half the time, your client opens the attachment, gets overwhelmed by bounce rates and API response times, and asks if their sales actually went up. That disconnect frustrates developers and store owners alike.
Why do traditional analytics reports confuse clients?
Most analytics dashboards are designed for growth hackers and engineers, not business owners who just want to know if their store is growing. When a client opens a standard analytics dump, they see numbers without context. They do not care that average position moved from 14 to 11 unless you explain what that means for the phone ringing. Drowning non-technical stakeholders in raw metric graphs usually leads to endless follow-up calls or, worse, clients who do not see the value in your ongoing retainer.
How do VeloCMS growth reports simplify client communication?
We shipped our new monthly growth reports on September 5th to bridge this exact gap. Instead of dumping raw database queries or complex traffic graphs on your clients, VeloCMS now compiles a clean, readable summary of the work you did this month, built entirely from figures you already have connected. It pulls rankings, backlinks, published content and page traffic into plain language that anyone can understand on a quick coffee break.
Your clients get a clean breakdown of what changed this month: keywords tracked and how many sit in Google's top ten, estimated organic visits, referring domains and links acquired, articles published, and page views counted by the site's own beacon. Every number comes with last month's figure next to it, so the direction is obvious without a degree in data science.
What does a report section actually look like?
This is the part most reporting tools get wrong: they hand you a chart and expect the client to translate it herself. VeloCMS writes the translation for you, section by section.
The rankings section reads something like this: "We tracked 42 keywords in September 2026. On average they sat at position 18.4, up from 21.2 in August 2026. 6 keywords now sit on page one. 9 keywords climbed and 4 slipped since August." No jargon, just what moved and by how much.
The search visibility section follows the same pattern, but it's careful to say where the number comes from: "Google has your site ranking for 340 keywords. The modelled organic traffic estimate was 2,850, 12% higher than last month. This estimate comes from a market model, not from your own analytics, so treat it as direction rather than a headcount." That last sentence matters. A client who thinks an estimate is a headcount will ask questions your real analytics can't answer.
Backlinks get the same honest framing: "Your site has links from 56 referring domains, up 4 on last month. 3 new links were logged this month. The profile figure counts every domain linking to you, including the press coverage you already had before we started." Content and page views close it out: how many articles went live, how the total is climbing, and how many times your pages were actually read, straight from the site's own beacon rather than a third-party estimate.
What should you write when the numbers go down?
Every agency hits a month where a keyword slips, a competitor outranks you, or search volume just dips for the season. The instinct is to bury the bad month or explain it away in a phone call the client half-remembers a week later. Neither works long term.
This is what the commentary field is for. Before you publish a report, you can add two or three sentences in your own words: a Google core update landed mid-month, a competitor shipped a bigger content push, seasonal search volume always dips in this category. That commentary sits right next to the numbers when the client opens the report, so your explanation and the dip arrive in the same breath instead of a separate, easy-to-forget conversation.
The report also refuses to fake a number it doesn't have. If a data source hasn't synced yet, or a snapshot didn't land this month, the section says so plainly rather than showing a zero that reads as a failure. A missing figure and a genuine zero look different on purpose, because a client should never mistake "we're still collecting this" for "nothing happened."
How does this fit into an agency's Monday?
Picture the reporting day you actually have, not the one on the retainer agreement. You open your VeloCMS workspace, and each client site already has a draft report waiting, generated from the same figures you've been watching all month. You skim it, add your two or three lines of commentary where a metric needs context, and publish it to that client's portal. Repeat for the next site.
There's no CSV export, no slide deck, and no separate email thread. Reports for past months stay in the same list, so if a client asks how things looked back in June, you're not digging through old exports to find out. Only the roles that manage the site can generate a draft or publish it; the client only ever sees the finished, published version once you've stood behind it.
How do you start sending these reports to your clients?
If you already manage client sites on VeloCMS, the new reporting features are waiting for you inside your workspace dashboard right now. You can preview the generated monthly draft, write a short commentary in your own words, and publish it to the client's portal when you are happy with it. It turns hours of monthly administrative overhead into a simple two-minute check.
If you are still wrestling with bloated legacy CMS platforms that require five different paid plugins just to send a basic email summary, it might be time to evaluate your tech stack. You can start building on VeloCMS today with our 14-day free trial (card required) and see how smooth client management can actually be.